Tropical cyclones (known as hurricanes in the Atlantic and as typhoons in the northwest Pacific) can cause severe damage to human livlihoods, infrastructure, and ecosystems (Fig. 1). While the immediate consequences are often widely reported, we know much less about the collective impact of successive cyclones over decades and about how cyclone impacts vary across landscapes. However, the impacts of cyclones through time can be an important consideration when considering infrastructure investment, government budgets, plantation establishment, or forest processes, for example.

The strength of a cyclone can be quantified using proxies. The maximum wind speed reached and the energy dissipated by a cyclone can be quantified in space and time and can provide a good indication of the likely damage caused to inrastructure and forests. Furthermore, overlaying all cyclones within a timeframe can provide an indication of the cyclone regime in a given location. This can be of great ecological relevance, as frequent cyclones should leave an imprint on the forest (for example, shorter trees to avoid snapping of the trunk) that has been little studied.
However, it is challenging to calculate and map the properties of cyclones, as this requires knowledge from various disciplines. The recently published package StormR for the R program statistical environment can calculate, for any location and for any cyclone, the maximum sustained wind speeds, total energy participated, and the length of exposure to winds above a specified wind speed. The package is the product of a collaboration between climatologists (Christophe Menkes and Swen Jullien), software developers (Baptiste Delaporte and Thomas Arszue), and ecologists (Thomas Ibanez and Gunnar Keppel).
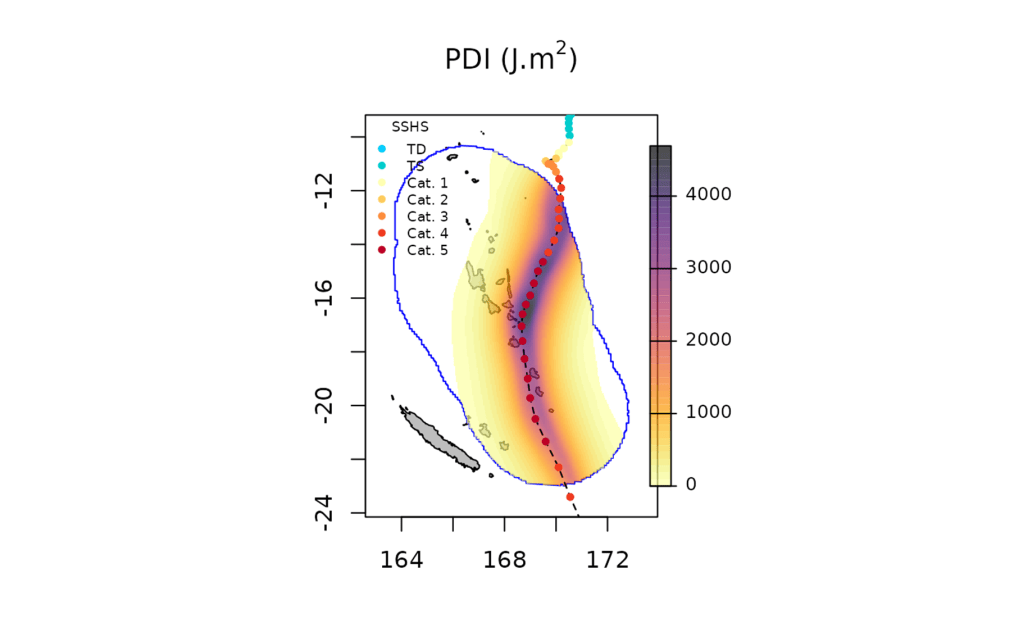
The package opens new lines of investigation with regard to cyclone impacts. One of the package’s most powerful features is that it can map the power dissipated by any cyclone in space (Fig. 2). Energy dissipate can the be related to the on-the-ground impact of a cyclone, such as the amount of infrastructure damage or tree mortality.
The ability to accurately map and quantify cyclones is of increasing importance. Tropical cyclones are forecast to become larger and more powerful as a result of climate change. They are also forecast to impact areas that have not experienced cyclones in the past, especially at higher latitudes. We envisage that information analyzed and mapped using this package can be used to predict the likely impact of future cyclone regimes and will allow us to prepare accordingly.
Further reading:
Delaporte B, T Arsouze, G Keppel, S Jullien, C Menkes & T Ibanez (2024) StormR: An R package to quantify and map the tropical storms and cyclones’ winds characteristics. The Journal of Open Source Software 9: 5766, https://doi.org/10.21105/joss.05766.
